TetraLite
Products
TetraProbe
An Low-cost Digitizing
Probe for CNC Applications.
Home | Description
| Performance | Order | Contact
Test Results
A Repeatability Test in Which I Reveal That
My Mill Is Not Perfect and Neither Is My Probe But Both Are Better Than I Might
Have Imagined
This test used G-code generated by the digitizing wizard (not the digitizing
plug-in) in Artsoft Controls
Mach3 Version R2.0.065. The wizard was set up to scan an area 1.0" wide
(X) by 0.5" high (Y) with X and Y steps of 0.025" resulting in a 40
by 20 point sampling grid with a total of 800 sample point. The object scanned
is an area on the table on my Taig mill. The table on my mill is like new, the
way it came from the factory and is undamaged in case you are wondering. The
G-code was run six times in a row, saving the outputted point cloud files each
time. These 6 point cloud files were then processed using the Global
Mapper program by first importing them with a scale factor on all three
(X, Y and Z) axes of 100,000. This was done because Global Mapper does not work
in inches, but defaults to meters as its basic unit of measurement. By scaling
up a factor of 100,000, the least significant digit from the point cloud files
(the 100-thousandths place) becomes the unit meters digit (the digit in the
"ones" place in the resulting units). For example, a Z axis reading
of -0.02019 is converted to -2019 meters -- an absolute unit
scaling factor of 100,000. The resulting elevations in Global Mapper are then
offset in order to make them positive numbers with the lowest elevation brought
up to zero. This is easily done because Global Mapper tells you the lowest and
highest elevations in the file, so all I did was add the absolute value of the
lowest point to all points by adding the offset, bringing them all up so that
the lowest point is at zero. At this point in Global Mapper, the resulting elevations
are now positive values within the range from lowest to highest. If the probe
were perfect, that number would indicate the greatest difference in elevation
points on the mill table. If the probe and the table were perfect all points
would be normalized to zero.
The images below were generated in Global Mapper and contour lines were overlayed
(also in Global Mapper) at 0.5 meter (5 millionths of an inch) intervals. Relative
locations in these images that look similar indicate more nearly the actual
error of the mill table. Relative locations that look different indicate errors
of the probe. Both errors can readily be seen in the images below.
The colors range from lowest to highest in the order: blue, green, yellow,
orange, red with transition colors in between. This shading method is known
as "atlas shading".
It can be inferred from these scans that the section of my mill table scanned
in these tests is obviously higher at lower values of Y, or, in other words,
it slopes down toward the back of the machine with an difference in height in
the 0.5" Y travel that was scanned of something less than 0.00016"
and perhaps roughly half that amount.
It can be further inferred from these scans that the Z axis measurement error
of the probe cannot be more than 0.00022" (the greatest difference in elevations
of all six scans) and is obviously less than that because of the slope of the
mill table and anomalies on the surface of the table. You can see small high
and low spots and areas that are in the same location on all six images. These
indicate "faults" of the table (or real vertical anomalies of the
surface). You can also see relative locations that are at different elevations
from one image to the other. These indicate probe errors (and to a lesser extent
I suppose, Z axis anomalies of the mill).
Ambient temperature changes during these test occured but were not documented.
Their effect is presumed to be extremely small in these results.
To get a better look at these images and a clearer view of the contour lines,
download the image and zoom in on it in your image viewer.
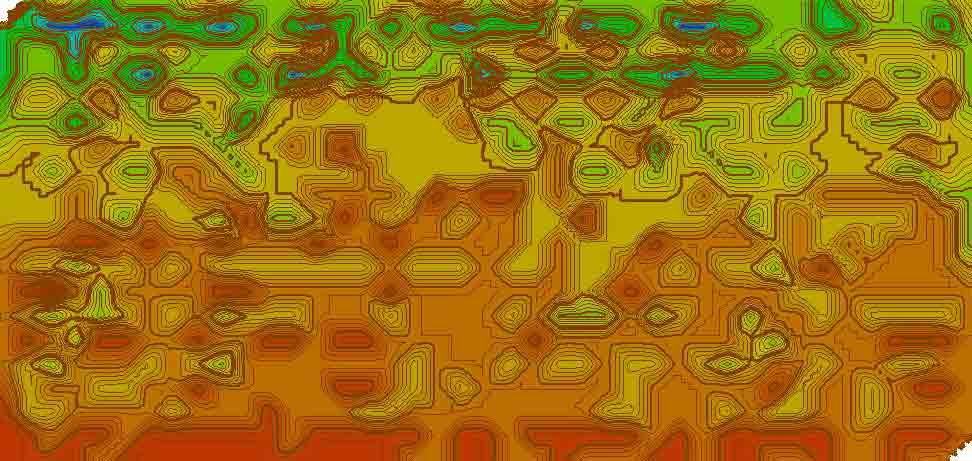 |
Scan 1
MIN ELEVATION = -2016 meters (-0.02016")
MAX ELEVATION = -1997 meters (-0.01997")
Difference = 19 meters (0.00019") |
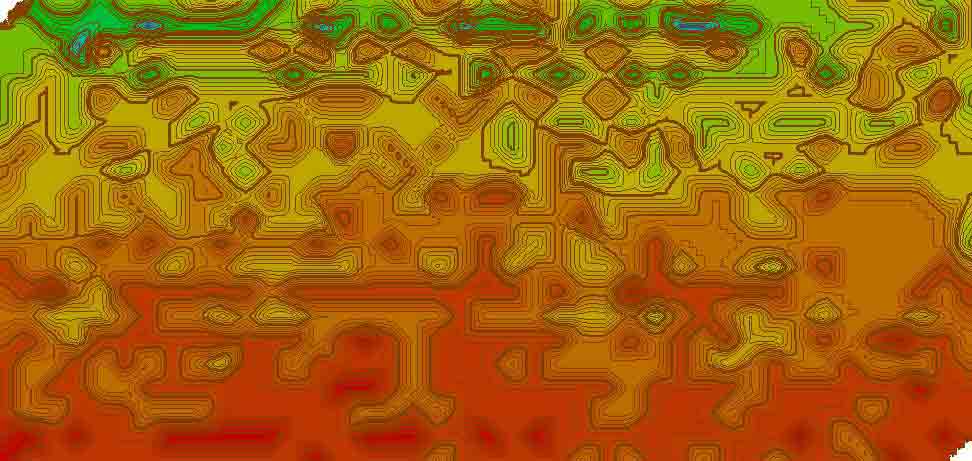 |
Scan 2
MIN ELEVATION = -2016 meters (-0.02016")
MAX ELEVATION = -1997 meters (-0.01997")
Difference = 19 meters (0.00019") |
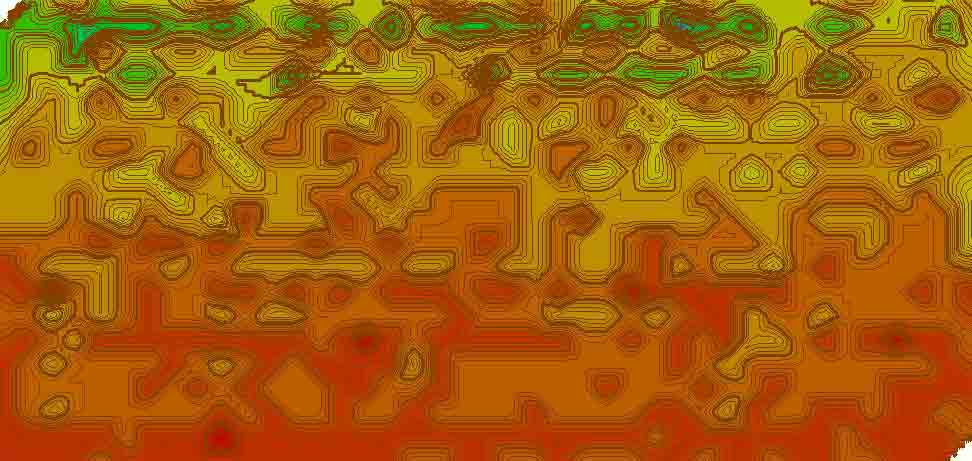 |
Scan 3
MIN ELEVATION = -2019 meters (-0.02019")
MAX ELEVATION = -1997 meters (-0.01997")
Difference = 22 meters (0.00022") |
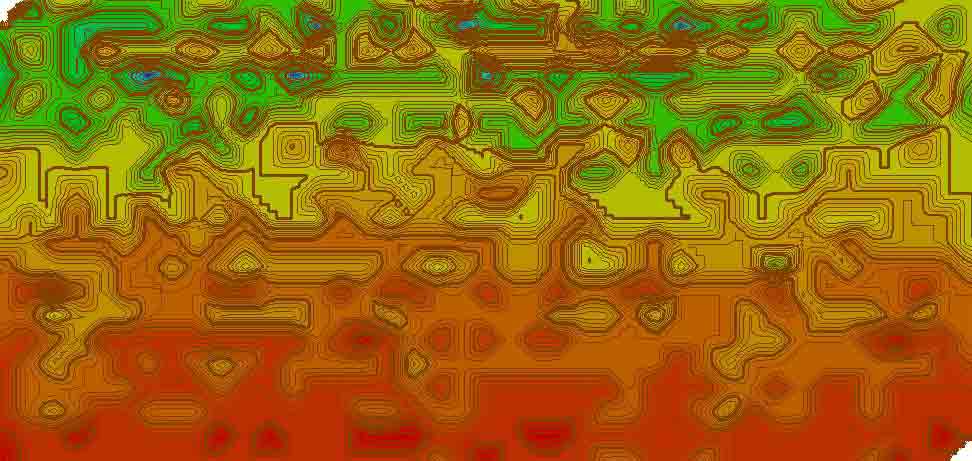 |
Scan 4
MIN ELEVATION = -2019 meters (-0.02019")
MAX ELEVATION = -1997 meters (-0.01997")
Difference = 22 meters (0.00022") |
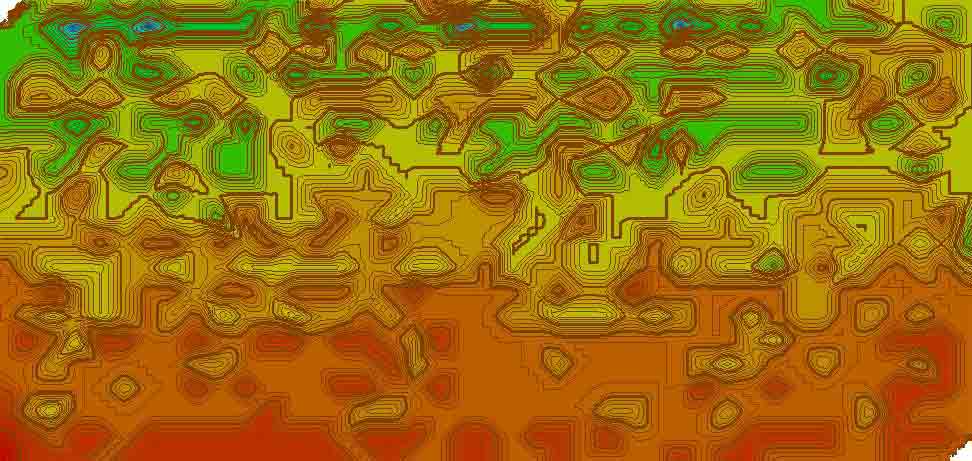 |
Scan 5
MIN ELEVATION = -2019 meters (-0.02019")
MAX ELEVATION = -1997 meters (-0.01997")
Difference = 22 meters (0.00022") |
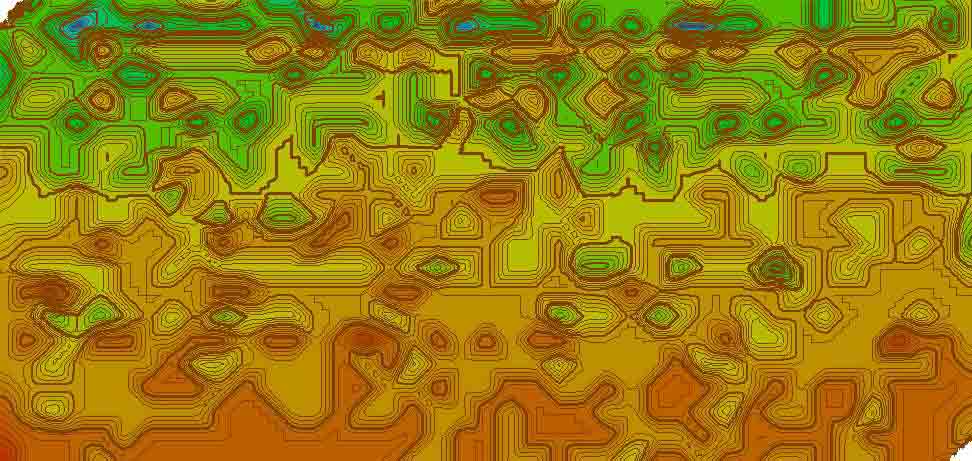 |
Scan 6
MIN ELEVATION = -2016 meters (-0.02016")
MAX ELEVATION = -1997 meters (-0.01997")
Difference = 19 meters (0.00019") |
Looking at these images it can be seen that many high and low spots are detected
in the same locations indicating actual variations of the mill table surface.
Although it looks rather rough overall, keep in mind that the maximum variation
we are seeing on all these scans is 0.00022" or less.
The contour lines are 5 millionths of an inch (0.000005" or 0.127 microns)
apart in elevation. Yikes! that's about 1/8th of a micron! But remember that
these contours lines represent extrapolated elevations in between the actual
measurement points, so the probe and the milling machine are in no way capable
of resolution this fine.